DIY Dangerousity in the AFL
Year 1 Master of Sport Analytics Project
By Daylon Seakins in Sport Analytics R
October 2, 2021
Task 1 - Dangerousity Equation
Link et al. [1] introduced the idea of dangerousity in their paper entitled Real-Time Quantification of Dangerousity in Soccer Using Spatiotemporal Tracking Data. Dangerousity can be referred to as the “quantitative representation of the likelihood of a goal”. This concept attempts to explain the scoring opportunity at any time a player possesses the ball (the paper explores dangerousity through soccer). Various contextual measures formulated together create this metric. This exploration will look at dangerousity through the lens of Australian Rules Football.
The data provided contains:
| Variable | SampleValue | Description |
|---|---|---|
| id_play | 2240 | Unique identifier for each play. |
| player_id | 250267 | Unique identifier for each player within a play. |
| team | att | Team a player belongs too, Attackers or Defenders. |
| clock | 89.6 | Time-stamp of the play. In total seconds within the quarter. |
| x | 51.2405791 | X plane location, in metres. |
| y | 2.87911156 | Y plane location, in metres. |
| v | 3.53327192 | Velocity of the player, in metres per second. |
| kicker | 0 | Kicker indicator (ball-carrier), denoted with a 1 or 0. |
| phase | GENERAL_PLAY | Type of play: Free, General Play, Mark or 50 metre Penalty. |
Dangerousity was approached with a normalisation of different measures to describe the overall dangerousity of the situation. It was assumed that the ball-carrier has full control of the ball.
Input Measures
The input measures for the dangerousity calculation are the Location of the ball-carrier, the Pressure being applied to the ball-carrier and the Passing potential for the ball-carrier.
These inputs are broken into subcategories and are assessed individually for their dangerousity. These values are then normalised against one-another to produce a final dangerousity value. All input measure dangerousity values are based on a range from 0 to 100. The final situational dangerousity value with this system should lay between 0 and 100 also.
Location
Distance is closely entwined with angle when initially assessing the level of dangerousity of a situation. The combination of distance and angle is relative to the centre of the goal line. A player’s location has a heavy influence on dangerousity as it dictates the level of difficulty of an attempted shot or whether the ball likely needs to be passed or carried further.
Expected Goal data would likely provide a greater explanation of location as a factor, and would be preferable if available. See the work of O’Shaughnessy [2].
The interaction between distance and value is described by the location value:
\(LocationValue_{s} = \frac{aDistanceValue_{s} + bAngleValue_{s}}{2}\)
s refers to information specific to the situation. a and b are unknown coefficients.
Distance
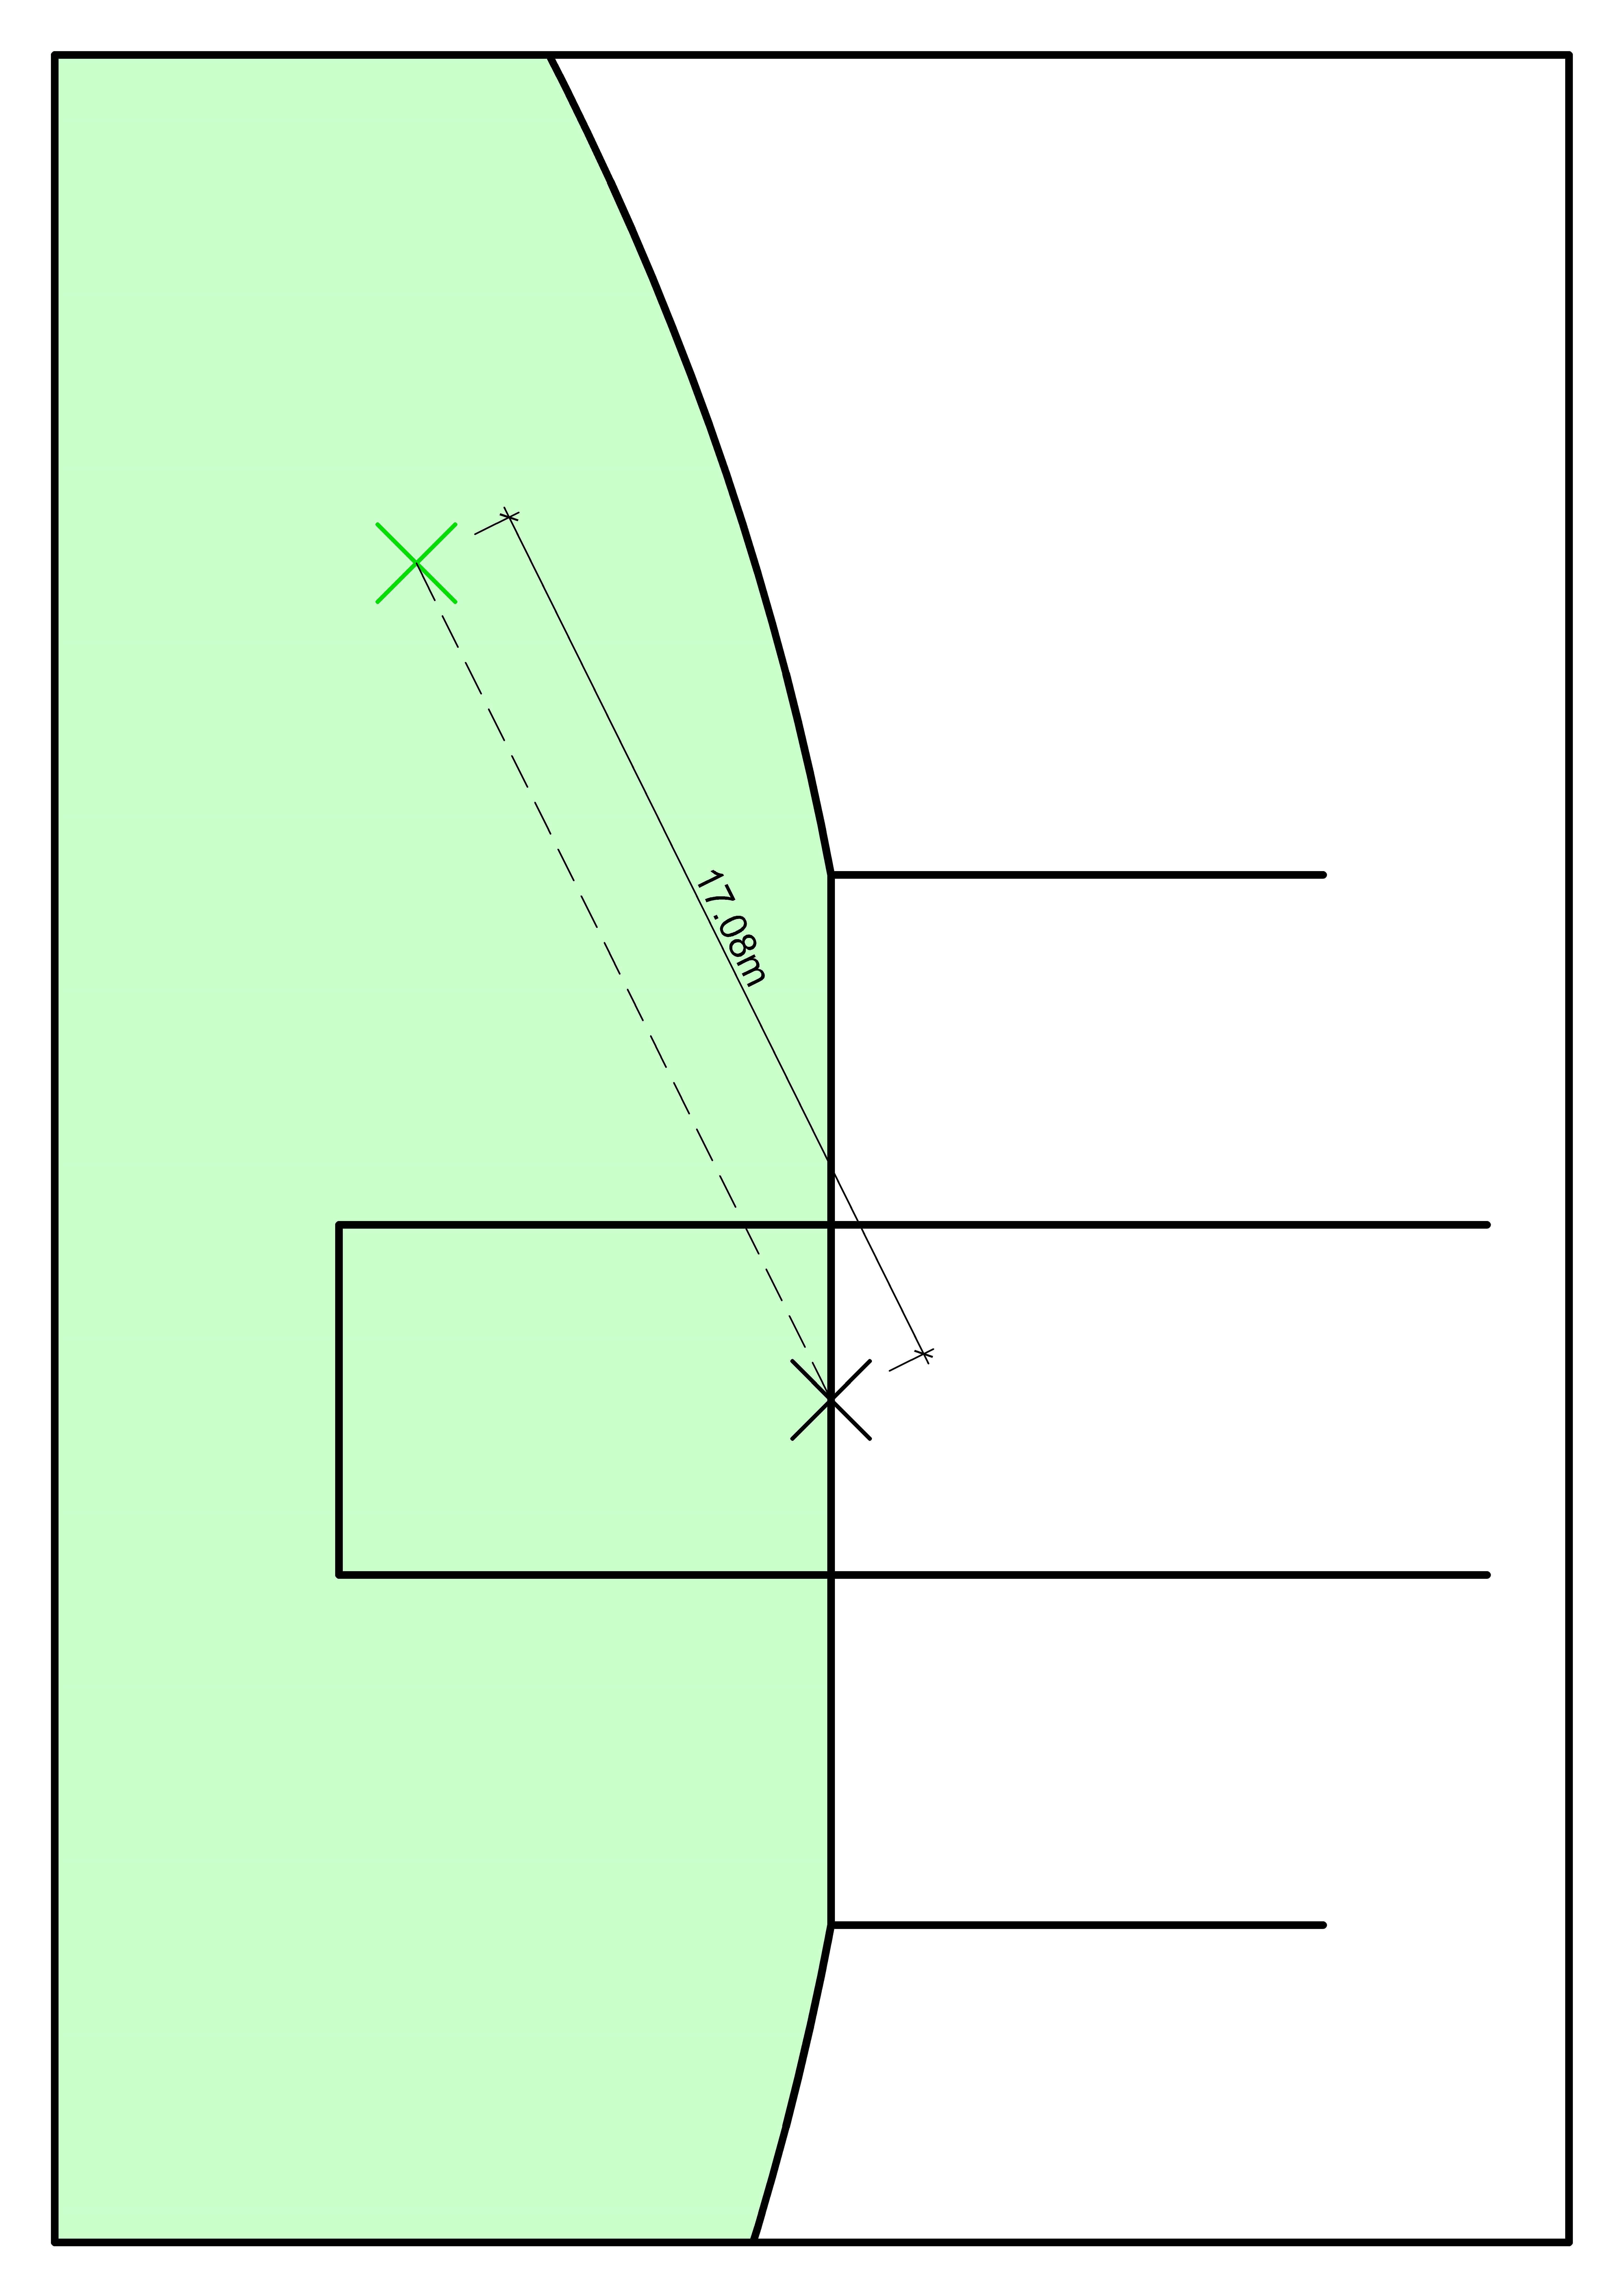
A measure of the distance between the ball-carrier and the centre of the goals, a direct Euclidean length. Distance was assessed as an important measure for dangerousity, as typically, the further from the goals that the ball-carrier, the less dangerous the situation, and the closer, the more dangerous. There is a steeper drop in dangerousity when the ball-carrier is 40m+ from goals, as this starts to test a player’s kicking range. See Figure 2.
The Distance Value was described with the following:
\(DistanceValue_{s} = 110(\frac{-tan^{-1}(0.15Distance_{bc} - 7.5)}{\pi}) + 49\)
bc refers to ball-carrier specific information, s refers to information specific to the situation.
Distance is the distance of the ball-carrier to the centre of the goals (in metres), Distance Value is the distance-specific dangerousity of the situation.

Figure 1: Ball-carrier (green) distance to the centre of the goal line

Figure 2: Distance-Specific Dangerousity
Angle
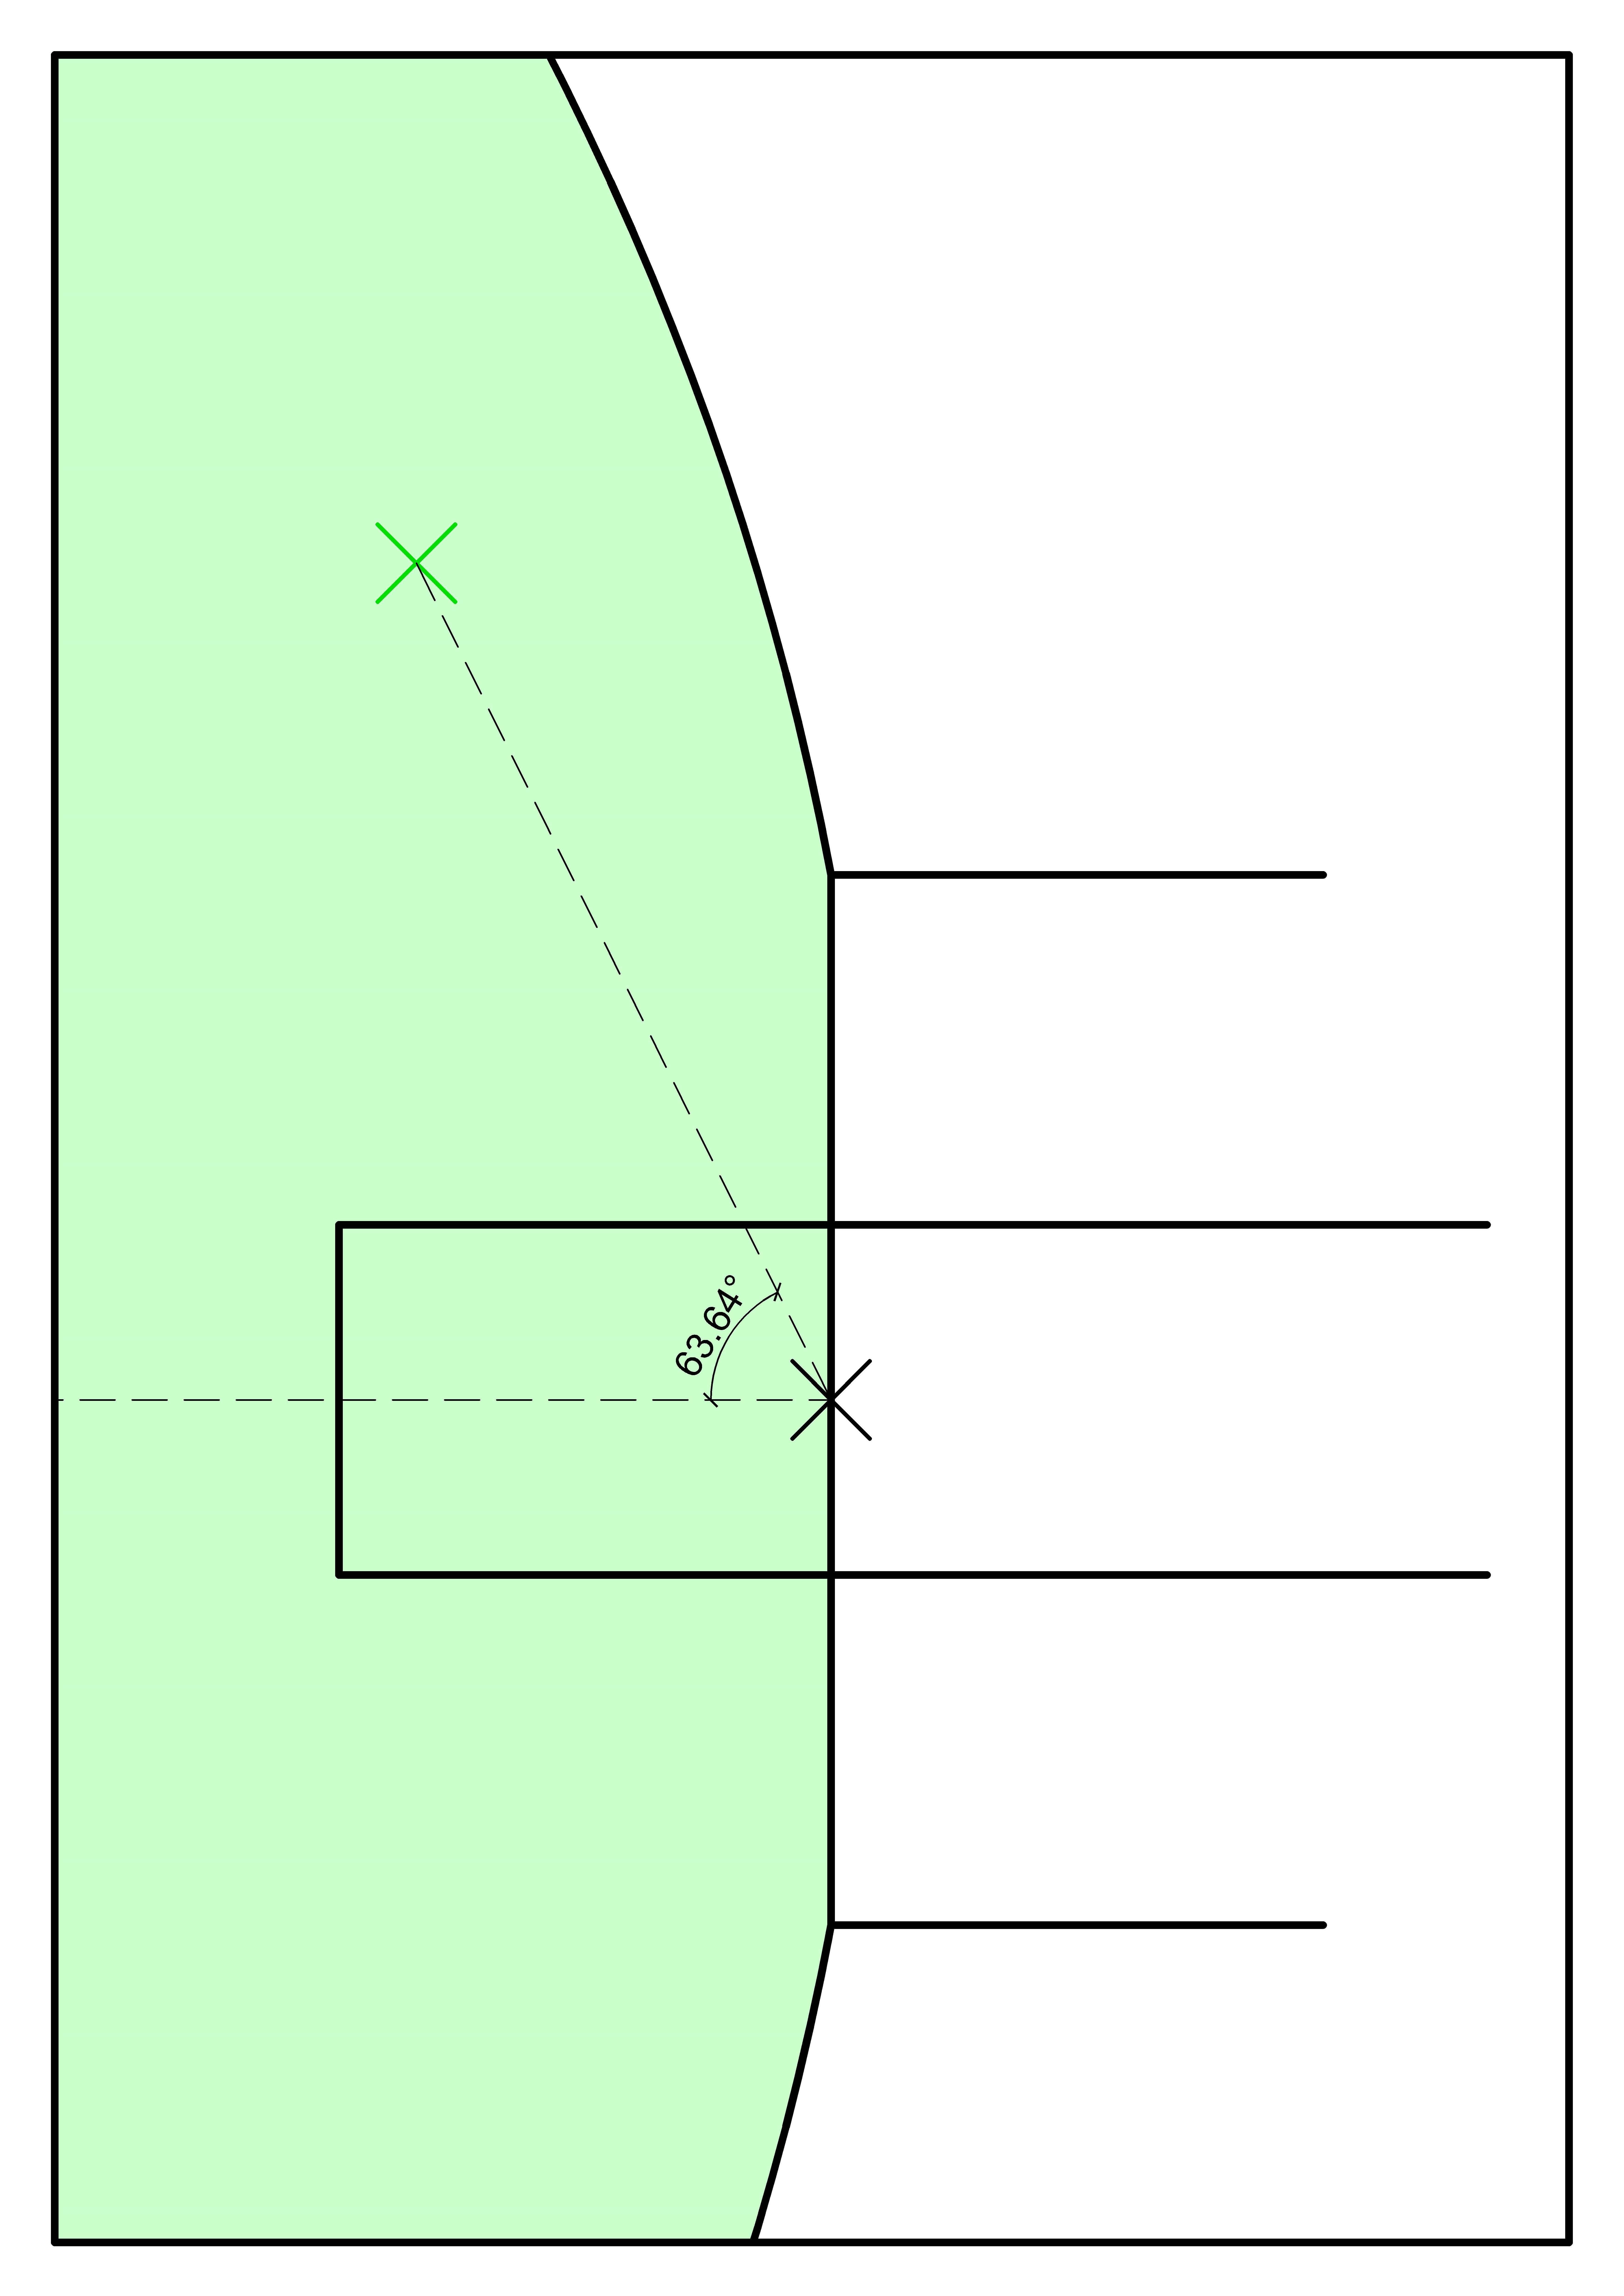
The angle between the ball-carrier to the centre of the goals, measured from a perpendicular plane to the goal-line. Harsher angles create less room for error when having a shot at goal. Difficulty remains relatively steady for head on shots at goal. An interaction between angle to goal and passing potential would be worth exploring with greater time and resources. See Figure 4.
The Angle Value was described with the following:
\(AngleValue_{s} = 50cos(0.035|Angle_{bc}|) + 50\)
bc refers to ball-carrier specific information, s refers to information specific to the situation.
Angle is the absolute angle of the ball-carrier to the centre of the goals , Angle Value is the angle-specific dangerousity.

Figure 3: Ball-carrier (green) angle to the centre of the goal line

Figure 4: Angle-Specific Dangerousity
Pressure
Pressure refers to the physical pressure, or perceived physical pressure applied to the ball-carrier. Pressure was categorised with in-front pressure and behind pressure. The calculation of pressure considers the differential of attackers and defenders and the density of defending players within the specified range.
Both measures were required as one cannot fully capture the scenario without the other. The differential of the players does not allow for the reasoning that a 2v1 situation (+1) is generally a better situation than a 11v10 (also +1). A ratio measure could also be considered (attackers:defenders), but has its own issues where 0 values cause problems, it is unable to counter for ratios being the same among different player counts, with different scenarios likely better than others (2v1 gives 2.0, 10v5 gives 2.0).
Density of the range requires the knowledge of how many players from each team are within the range, which is where the interaction with the differential comes in.
An extra feature of this calculation is that if the density of defenders is registered as less than 1, the differential is automatically set to the maximum dangerousity. This is because the differential calculation cannot determine the difference between 0-0 and other even differentials (1-1, 2-2, etc.). It is set to the maximum dangerousity as no pressure is objectively more dangerous than “neutral” pressure.
Differential is described by a higher than moderate dangerousity for an advantage, and lower than moderate dangerousity for a disadvantage in differential. This dangerousity tapers off as the differential becomes greater due to the impact made becoming smaller and smaller.
Density is described by a maximal dangerousity at 0 density that drops away when a defender is within the specified range. This also tapers off as the impact of more defenders becomes smaller and smaller.
Pressure rating information would likely produce a better representation of pressure if available.
The interaction between pressure in-front and behind is described by the pressure value:
\(PressureValue_{s} = \frac{aInFrontValue_{s} + bBehindValue_{s}}{2}\)
s refers to information specific to the situation. a and b are unknown coefficients.

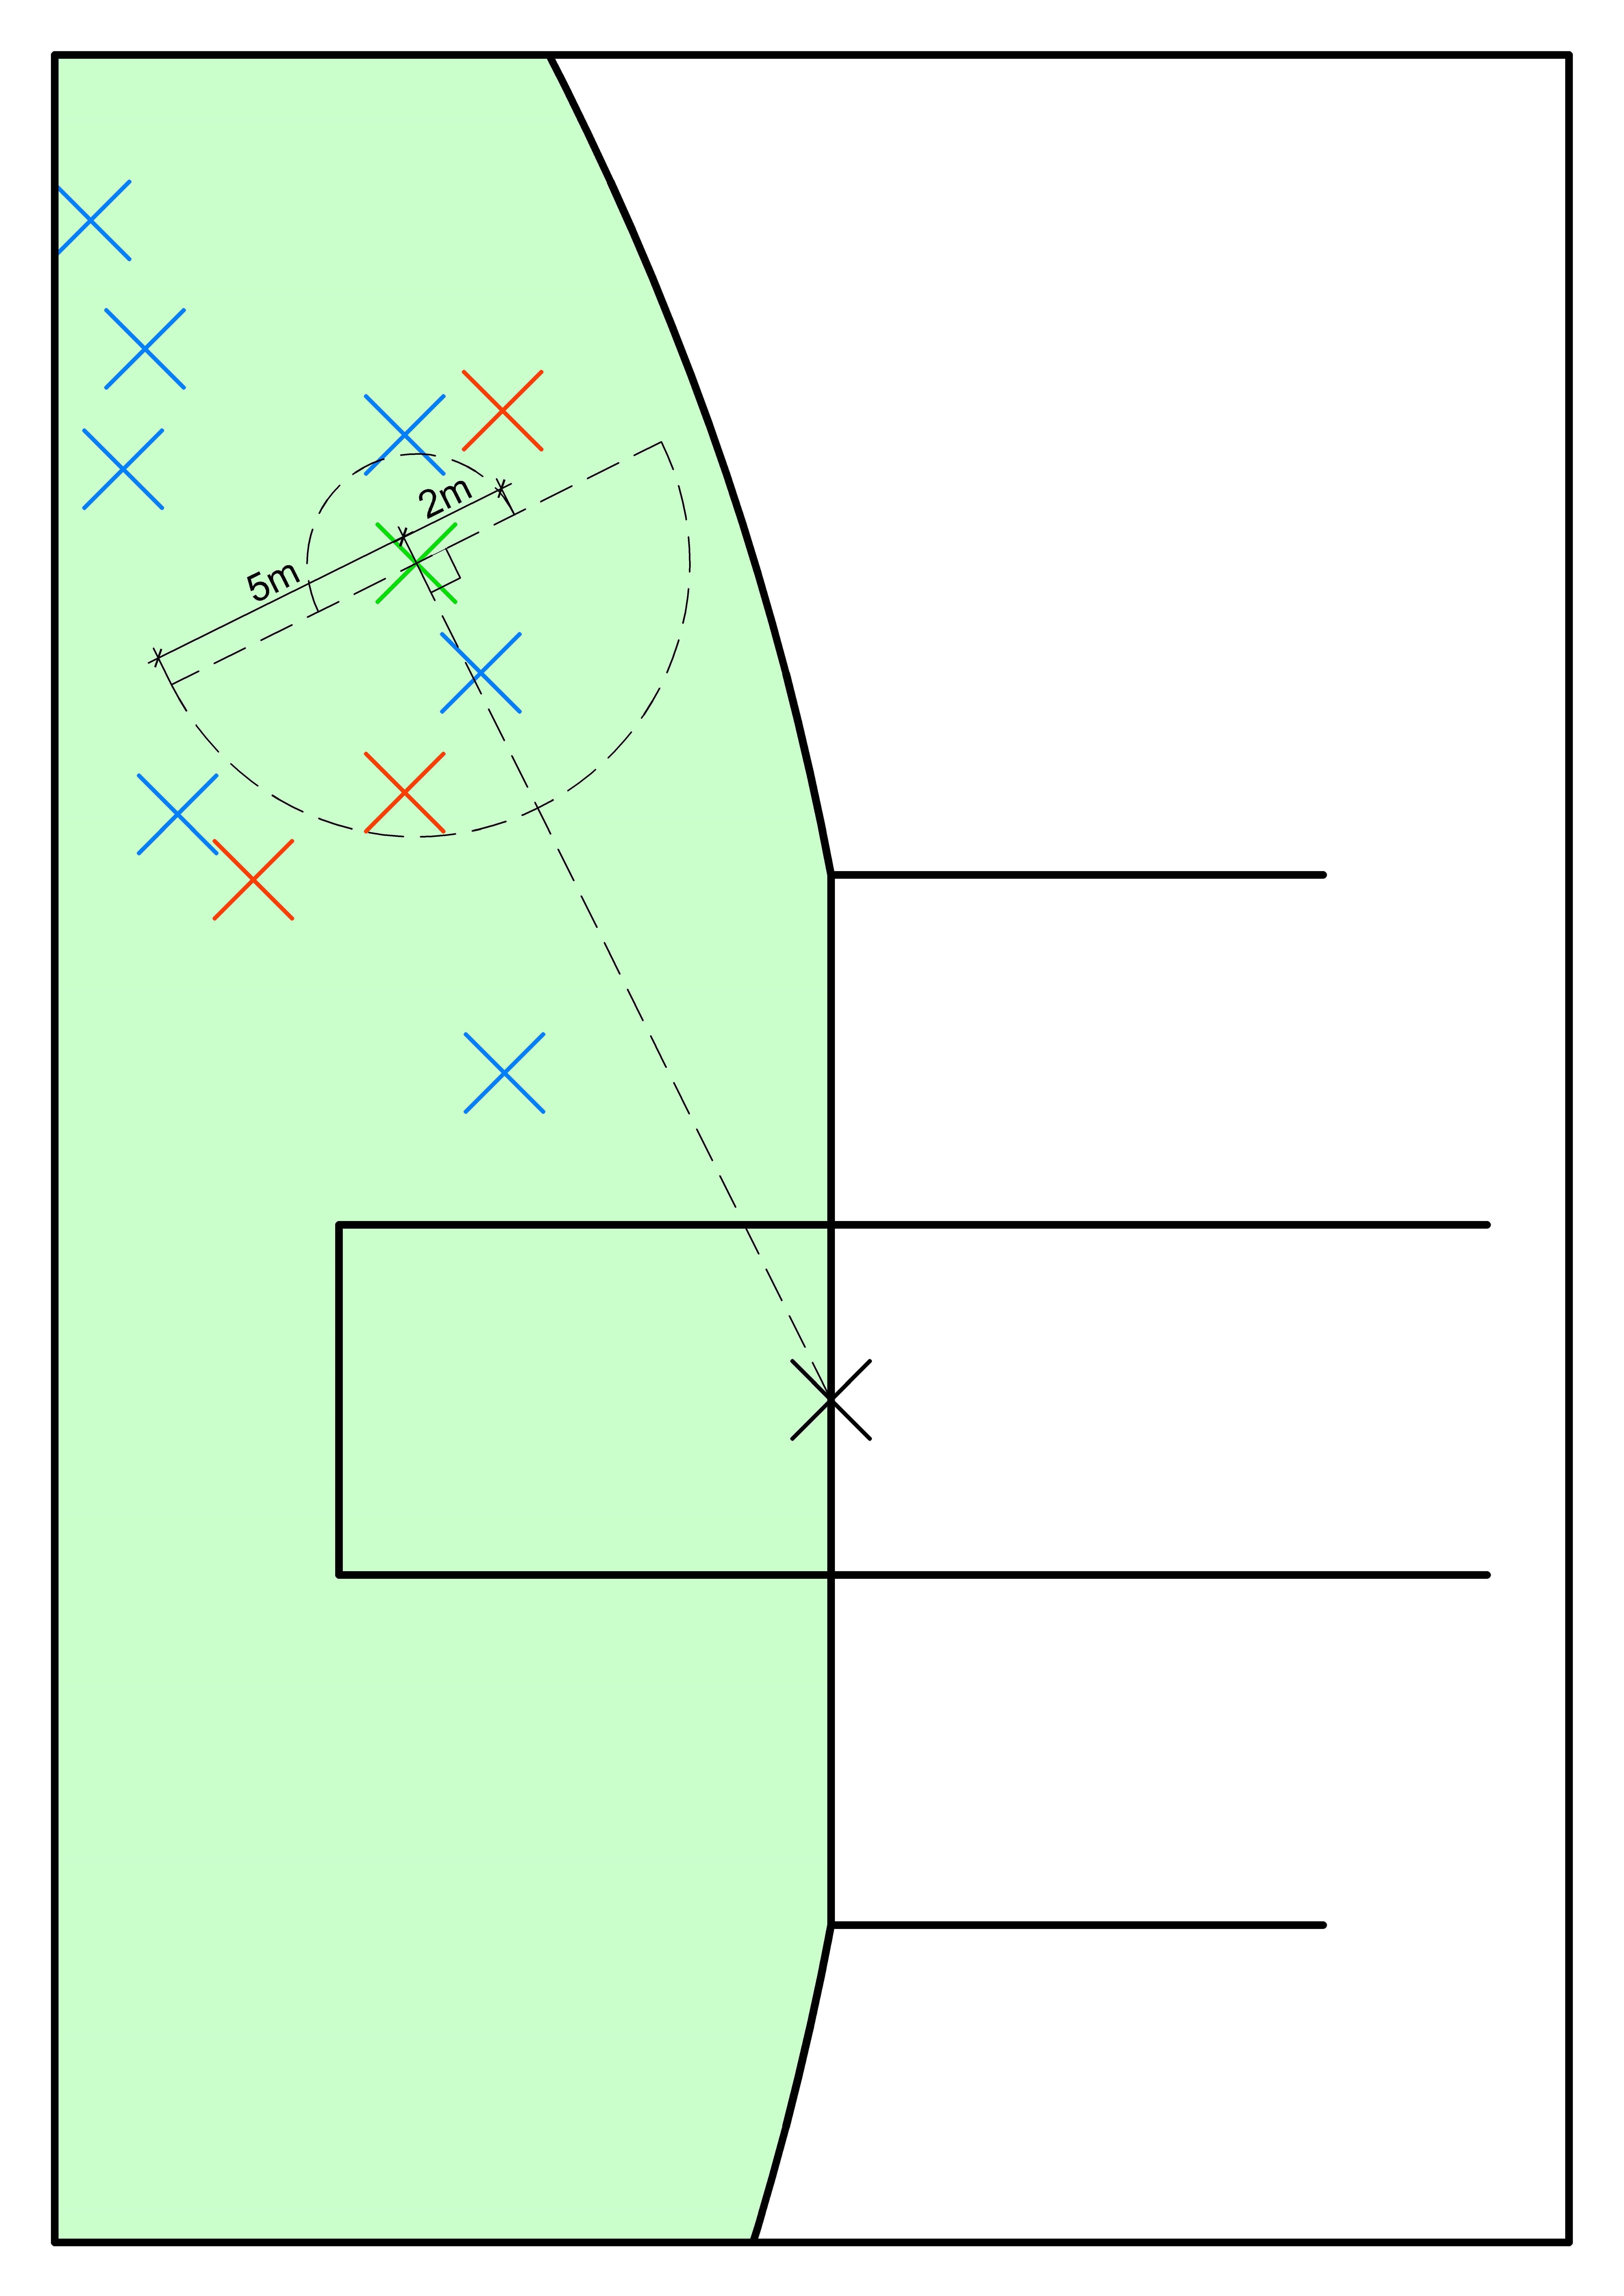
Figure 5: Attackers (red) and defenders (blue) within 5 metres of the ball-carrier (green)
In Front (5m)
In front of the ball-carrier was defined as within 5 metres and ahead of the ball-carrier, assuming the ball-carrier is facing directly towards the centre of the goals. This is constructed with a perpendicular plane to the same line that calculates the ball-carrier distance to the centre of the goals. Defenders in front of the ball-carrier have a higher weighting of danger as they are more likely able to smother, tackle and physically pressure the ball-carrier. Attackers within the same range may be able to affect a defenders ability to engage the ball-carrier and have been accounted for in this calculation (pressure differential). 5 metres was dictated as the range for front-on pressure as the opposing players are likely travelling in opposite directions and headed towards each other. See Figures 6 and 7.
The In Front Value was described with the interaction between pressure differential and density:
\(InFrontValue_{s} = \frac{aInFrontDifferentialValue_{s} + bInFrontDensityValue_{s}}{2}\)
In Front Differential Value is the differential between attackers (+) and defenders (-) in front of the ball-carrier and within 5 metres, In Front Density Value is a count of the defenders in front of the ball-carrier and within 5 metres, In Front Value is the in-front-specific dangerousity.
The In Front Differential Value was described with the following:
\(InFrontDifferentialValue_{s} = 100(\frac{tan^{-1}(2(NumAtt_{bc} - NumDef_{bc}))}{\pi}) + 50\)
The In Front Density Value was described with the following:
\(InFrontDensityValue_{s} = 200(\frac{tan^{-1}(NumAtt_{bc} - NumDef_{bc})}{\pi}) + 100\)
NumAtt and NumDef refer to the count of attackers and defenders respectively, in the given range.
bc refers to ball-carrier specific information, s refers to information specific to the situation. a and b are unknown coefficients.

Figure 6: Pressure In Front Differential-Specific Dangerousity

Figure 7: Pressure In Front Density-Specific Dangerousity
Behind (2m)
Behind the ball-carrier was defined as within 2 metres and behind the ball-carrier, assuming the ball-carrier is facing directly towards the centre of the goals. This is constructed with a perpendicular plane to the same line that calculates the ball-carrier distance to the centre of the goals. A defender behind the ball-carrier is likely only able to tackle or physically pressure the ball-carrier. A player behind the ball-carrier also likely has to chase-down the ball-carrier as they are likely travelling in the same direction. See Figures 8 and 9.
The Behind Value was described with the interaction between pressure differential and density:
\(BehindValue_{s} = \frac{aBehindDifferentialValue_{s} + bBehindDensityValue_{s}}{2}\)
Behind Differential Value is the differential between attackers (+) and defenders (-) behind the ball-carrier and within 2 metres, Behind Density Value is a count of the defenders behind the ball-carrier and within 2 metres, Behind Value is the behind-specific dangerousity.
The Behind Differential Value was described with the following:
\(BehindDifferentialValue_{s} = 100(\frac{tan^{-1}(2(NumAtt_{bc} - NumDef_{bc}))}{\pi}) + 50\)
The Behind Density Value was described with the following:
\(BehindDensityValue_{s} = 200(\frac{tan^{-1}(0.9(NumAtt_{bc} - NumDef_{bc})- 0.05)}{\pi}) + 97\)
NumAtt and NumDef refer to the count of attackers and defenders respectively, in the given range.
bc refers to ball-carrier specific information, s refers to information specific to the situation. a and b are unknown coefficients.

Figure 8: Pressure Behind Differential-Specific Dangerousity

Figure 9: Pressure Behind Density-Specific Dangerousity
Passing
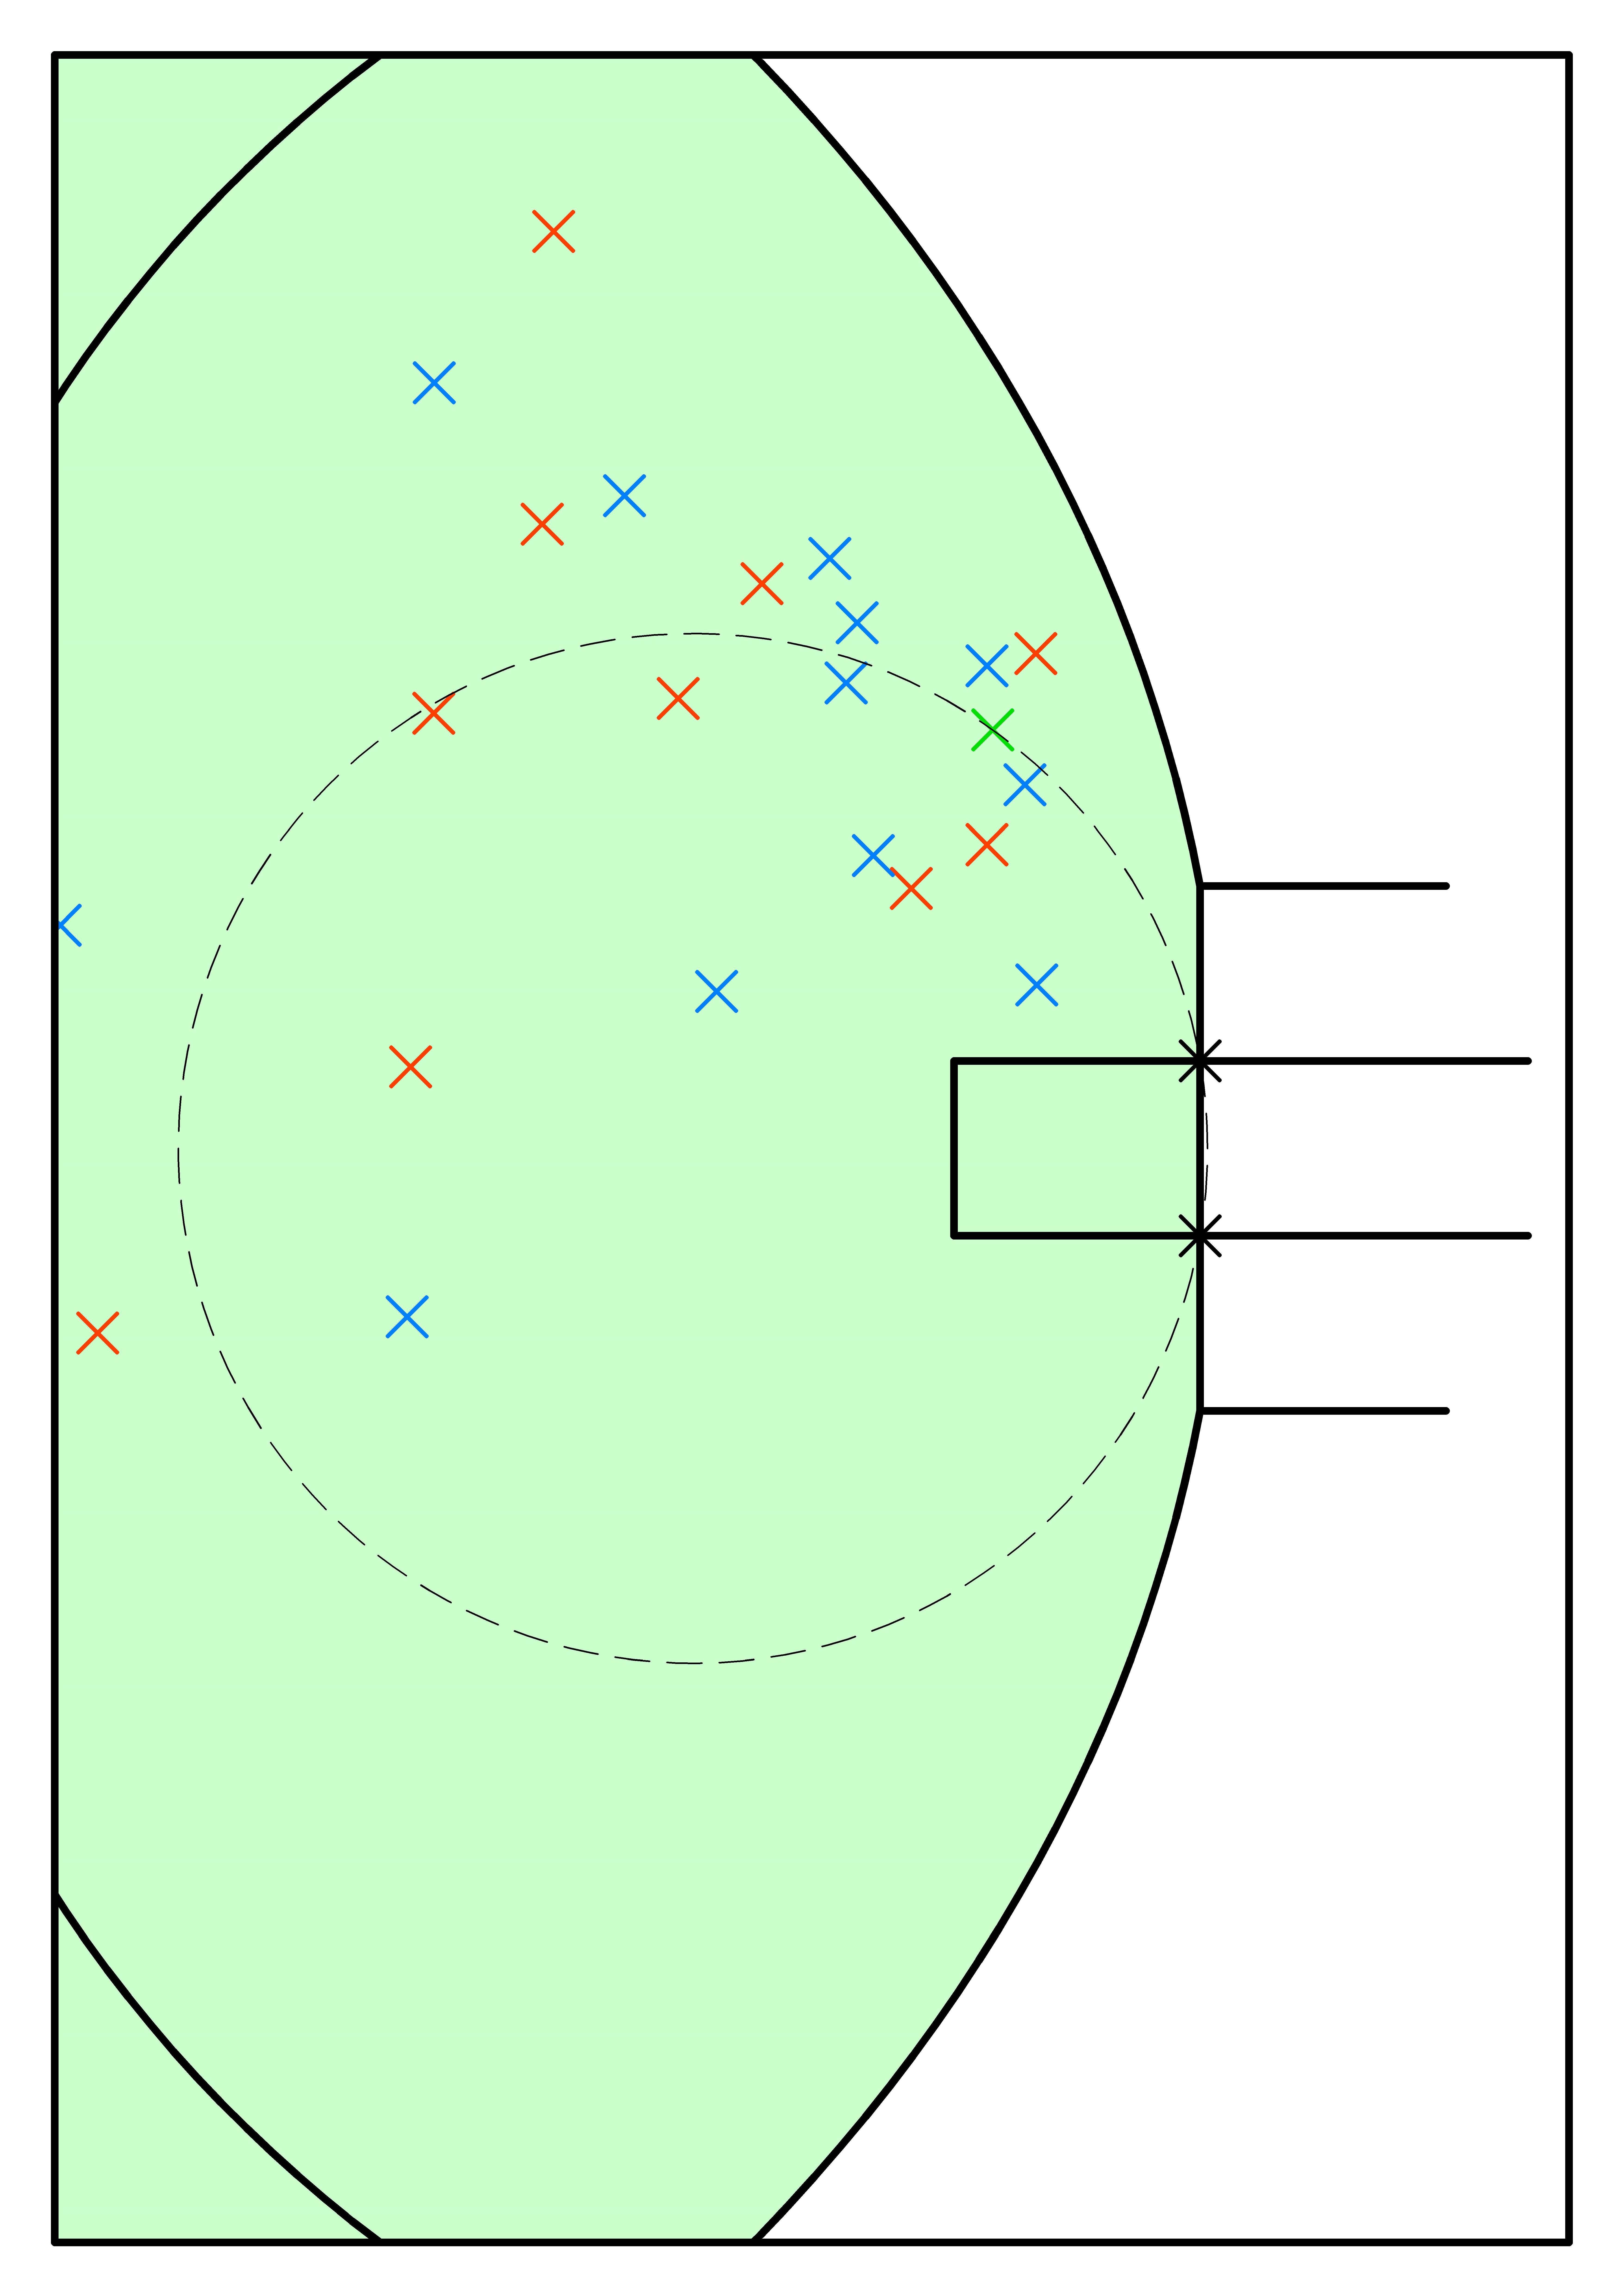
Adapted from the ideas of Galbraith and Lockwood [3], this method treats players “in front” of the ball-carrier as those within a circle made up of the location of the ball-carrier and the two goal posts. This approach was used as players “closer” may not be relevant to the play at hand. Alternate methods of “in front” include Euclidean distances to the centre of the goals, similar to how Distance is handled, or a direct X-coordinate difference. Both approaches have unwanted capacity to include irrelevant players in it’s calculation. The “opportunity circle” approach treats players as only relevant if they fall within an area of equal opportunity range, that is where any location within the circle is equal to or improves the angle at goals. This approach still creates some outliers, but overall is a greater representation.
Whilst not exactly what Galbraith and Lockwood [3] intended, it creates a more relevant inclusion of players.
Similarly to the Pressure input measure, the Passing input measure is based off of the differential of attackers and defenders within the “opportunity circle” and the density of players (defenders) within the “opportunity circle”.
Differential is described by a higher than moderate dangerousity for an advantage, and lower than moderate dangerousity for a disadvantage in differential. This dangerousity tapers off as the differential becomes greater due to the impact made becoming smaller and smaller.
Density for passing is described by a maximal dangerousity at 0 density that drops away when a defender is within the specified range. The rate of decline is dictated by the distance of the ball-carrier from the goals. This also tapers off as the impact of more defenders becomes smaller and smaller.
The Passing Value was described with the interaction between the “opportunity circle” differential and density:
\(PassingValue_{s} = \frac{aPassingDifferentialValue_{s} + bPassingDensityValue_{s}}{2}\)
s refers to information specific to the situation. a and b are unknown coefficients.

Figure 10: Attackers (red) and defenders (blue) within the “opportunity circle”, dictated by the ball-carrier (green) and goal posts
Differential
The differential of attackers and defenders within the “opportunity circle” is used in the passing value equation. Unlike the pressure differential, the passing differential does not default to maximum danger when no defenders are within the passing circle. This is because this differential is based only on the passing potential of the ball-carrier. Space of greater opportunity (space “in front”) is represented from this method and could be further implemented with greater time and resources, but in this instance, only passing potential is considered.
The Passing Differential Value was described with the following:
\(PassingDifferentialValue_{s} = 100(\frac{tan^{-1}(2(NumAtt_{bc} - NumDef_{bc}))}{\pi}) + 50\)
NumAtt and NumDef refer to the count of attackers and defenders respectively, in the given range.
bc refers to ball-carrier specific information, s refers to information specific to the situation.

Figure 11: Passing Differential-Specific Dangerousity
Density
The density of players within the “opportunity circle” is required to establish a a count of defenders within the specified range. Again, similar to the interaction of differential and density in pressure, passing works much the same.
There is an extra element to the definition of a dense “opportunity circle”, as this dynamically changes based on the location of the ball-carrier. To account for this, the distance of the ball-carrier modifies the coefficient in the function calculation. The distance ranges to coefficient conversions were rationalised on the basis of having 6 defenders within the 50 metre arc, this is based on the standard AFL position. With a “full” backline, dangerousity is deemed to be slightly lower than moderate. From this initial rationalisation, ranges were broken into 10m intervals. Each coefficient produces approximately a 40 dangerousity score from the neutral density. See below:
| BallCarrierDistanceFromGoal | Coefficent | DefendersForNeutralDensity |
|---|---|---|
| <10m | 1.35 | 1 |
| 20m < 10m | 0.69 | 2 |
| 30m < 20m | 0.46 | 3 |
| 40m < 30m | 0.34 | 4 |
| 50m < 40m | 0.28 | 5 |
| 60m < 50m | 0.23 | 6 |
| 70m < 60m | 0.20 | 7 |
| 80m < 70m | 0.17 | 8 |
| > 80m | 0.15 | 9 |
The Passing Density Value was described with the following:
\(PassingDensityValue_{s} = 200(\frac{tan^{-1}(DensityCoefficient_{bc} NumDef_{bc})}{\pi}) + 100\)
DensityCoefficient is the coefficient dictated by the distance of the ball-carrier, NumDef refers to the count of defenders in the given range.
bc refers to ball-carrier specific information, s refers to information specific to the situation.

Figure 12: Passing Density-Specific Dangerousity. Note: Vertical lines correspond to each distance range’s neutral density and produce a dangerousity of approximately 40.
Formula
The input measures each have dangerousity associated to them specifically and the interaction between them is averaged to create a final dangerousity score.
The given data has four types of phases: General Play, Free, Mark or 50m Penalty.
The Set Phase Formula - Free, Mark, 50m Penalty:
\(Dangerousity_{s} = \frac{aDistanceValue_{bc} + bAngleValue_{bc} + cPassingValue_{s}}{3}\)
bc refers to ball-carrier specific information, s refers to information specific to the situation. a and b are unknown coefficients.
The closer the ball-carrier is to goals, the more dangerous the situation. The closer the angle is to 0° (directly in front of goals), the more dangerous the situation. This is very applicable to the controlled situation of a set shot, mark or free kick, especially if a player is within typical scoring distance. Passing is also parsed as factor as to what options are available to the ball-carrier. A weighting of these values would be appropriate, and would ideally be done inferentially and is indicated with a, b and c.
The General Phase Formula - General Play:
\(Dangerousity_{s} = \frac{aLocationValue_{s} + bPressureValue_{s} + cPassingValue_{s}}{3}\)
s refers to information specific to the situation. a and b are unknown coefficients.
A general play measure is more complicated, with more factors affecting the likelihood of scoring. All factors investigated are included in the general play formulation as these best explain the overall situation. Location affecting the difficulty of a potential shot, and potentially the importance of a pass. Pressure affecting the ability of the ball-carrier to make a good decision and execute the decision effectively, and passing to explain the potential of improving the situation to a more dangerous one. Like the previous formula, inferentially examined coefficients would be appropriate to produce a greater dangerousity score if possible. These are denoted with a, b and c.
Limitations
An alternate way of assessing distance and angle would be to look at the work of Galbraith and Lockwood [3]. This considers the angle of error between the goal posts and the angle given to each goal posts from where the kicker is. This dynamically changes the angle depending on the distance of the kicker. This is likely a better approach but may be beyond the scope of this formulation.
With greater time and resources, a more advanced equation would have more inferentially researched, likely with coefficients that weight each of the measures to appropriate levels. For example, passing isn’t as relevant when the ball-carrier is within a comfortable kicking distance and angle with lower to moderate pressure. This is acknowledged in the formulas throughout the explanations, denoted with a, b and c where appropriate.
Other inputs that may have been applicable to the equation would be whether a defender or attacker was closer to the ball-carrier within a specific zone of the ball-carrier’s 5 metre radius. This could suggest whether an attacker was able to shepherd or block a defender from getting to the ball-carrier.
It could be worth investigating further contextual factors with historical data such as weather conditions, venue-specific conditions, velocity of players or expected goal information.
Task 2 - Equation Applied
The Dangerousity Formulas has been applied to the given data set.
Dangerousity per Situation
| PlayID | Dangerousity |
|---|---|
| 1263 | 58.09 |
| 2006 | 72.36 |
| 2050 | 83.78 |
| 2240 | 44.21 |
| 3442 | 65.87 |
| 5712 | 62.81 |
| 6253 | 79.00 |
| 6970 | 77.81 |
| 8929 | 90.96 |
| 9087 | 84.08 |
| 9128 | 71.98 |
| 12176 | 96.81 |
| 12491 | 42.43 |
| 12995 | 71.99 |
| 16425 | 73.66 |
| 16994 | 74.59 |
| 18026 | 65.61 |
| 18876 | 72.80 |
| 19967 | 55.21 |
| 20184 | 76.46 |
| 20556 | 72.73 |
| 22384 | 72.65 |
| 23336 | 79.77 |
| 25659 | 74.52 |
| 26795 | 70.98 |
| 30087 | 60.01 |
| 31090 | 89.36 |
| 31641 | 59.39 |
| 34993 | 69.98 |
| 37635 | 52.38 |
Situation Visualisations

Figure 13: Dangerousity Formula apllied to data provided, with dangerousity score included